Overview
The Practice Dashboard provides a snapshot of your practice's key performance indicators for any selected period. It brings together revenue, visit activity, and patient referral data in one place, allowing you to monitor practice health and identify trends over time.
The dashboard is accessible from the Super Admin section of Settings.
Selecting a Time Period
At the top of the dashboard you can choose the time period you want to report on. There are four preset options: Last Week (the previous full calendar week, Monday to Sunday), Last Month (the previous full calendar month), 3 Months (the three calendar months prior to the current month), and 12 Months (the twelve calendar months prior to the current month).
You can also set a custom date range using the From and To date fields. Once you have entered your dates, click the Update button to apply them. The active preset is highlighted in blue. When a custom range is entered, none of the preset buttons will appear highlighted.
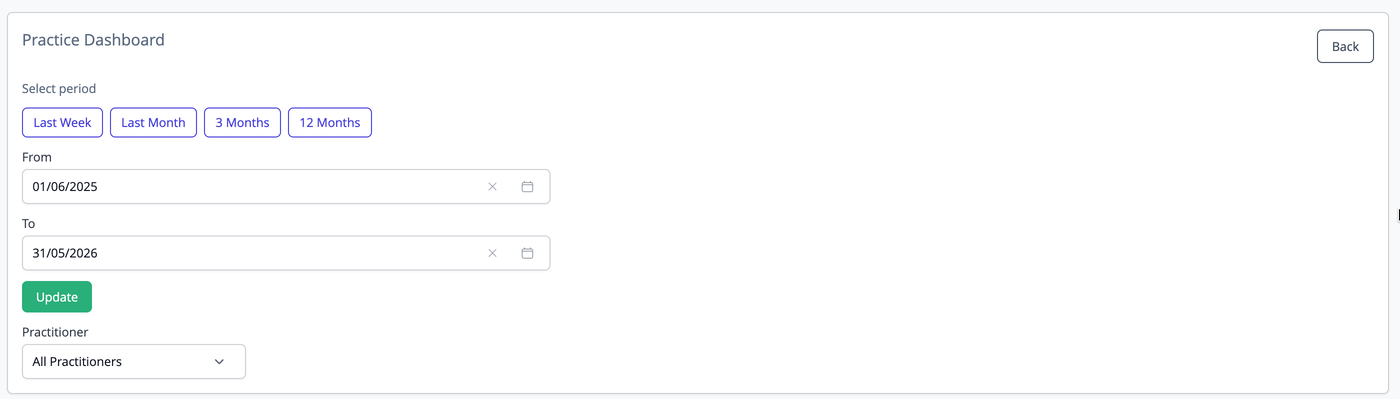
Practitioner Filter
By default the dashboard shows data for all practitioners. Use the Practitioner dropdown to filter all statistics and charts to a single practitioner. Note that Credit Balances and Outstanding Accounts are practice-wide figures and are not affected by the practitioner filter, as account balances belong to the patient rather than to a specific practitioner.
Key Performance Indicators
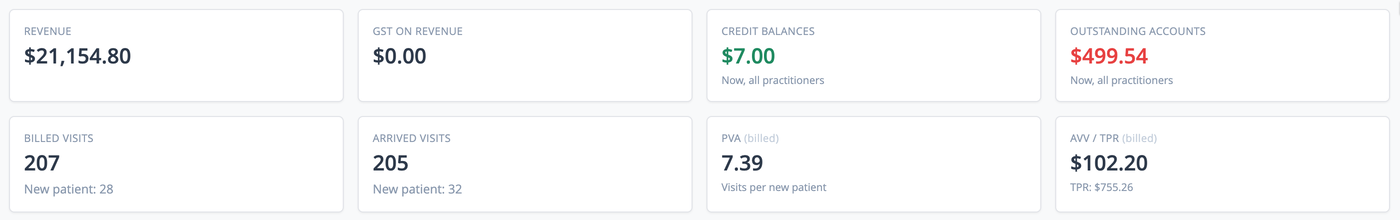
The dashboard displays eight KPI cards across two rows.
Revenue is the total amount collected for the selected period and practitioner. Tax on Revenue is the Tax component of that collected revenue.
Credit Balances shows the total value of patient accounts that are currently in credit, meaning the practice owes money to those patients. Outstanding Accounts shows the total owed to the practice by patients whose balances are in arrears. Both of these figures reflect the current position across all practitioners and all time, not just the selected date range.
Billed Visits is the number of service items billed on invoices within the selected period. The sub-figure below shows how many of those were for new patients. Arrived Visits is the number of appointments recorded as Arrived within the selected period, with a similar new patient sub-figure. Billed and Arrived visits will often differ. Arrived is based on the appointment calendar, while Billed is based on invoices raised. Discrepancies can indicate unbilled appointments, billing that occurred outside the appointment date or billing multiple services for one appointment.
PVA (Patient Visit Average) is the average number of visits per new patient, calculated as total billed visits divided by the number of new patient billed visits in the period.
AVV (Average Visit Value) is the average revenue per billed visit.
TPR (Total Patient Revenue) is PVA multiplied by AVV, representing the estimated total revenue generated per new patient. Both are shown together in the final card.
Trend Charts
Below the KPI cards, three line charts display how revenue and visit numbers have changed over the selected period: Revenue (total collected), Billed Visits (service items invoiced), and Arrived Visits (arrived appointments). All three charts share the same date range and grouping.
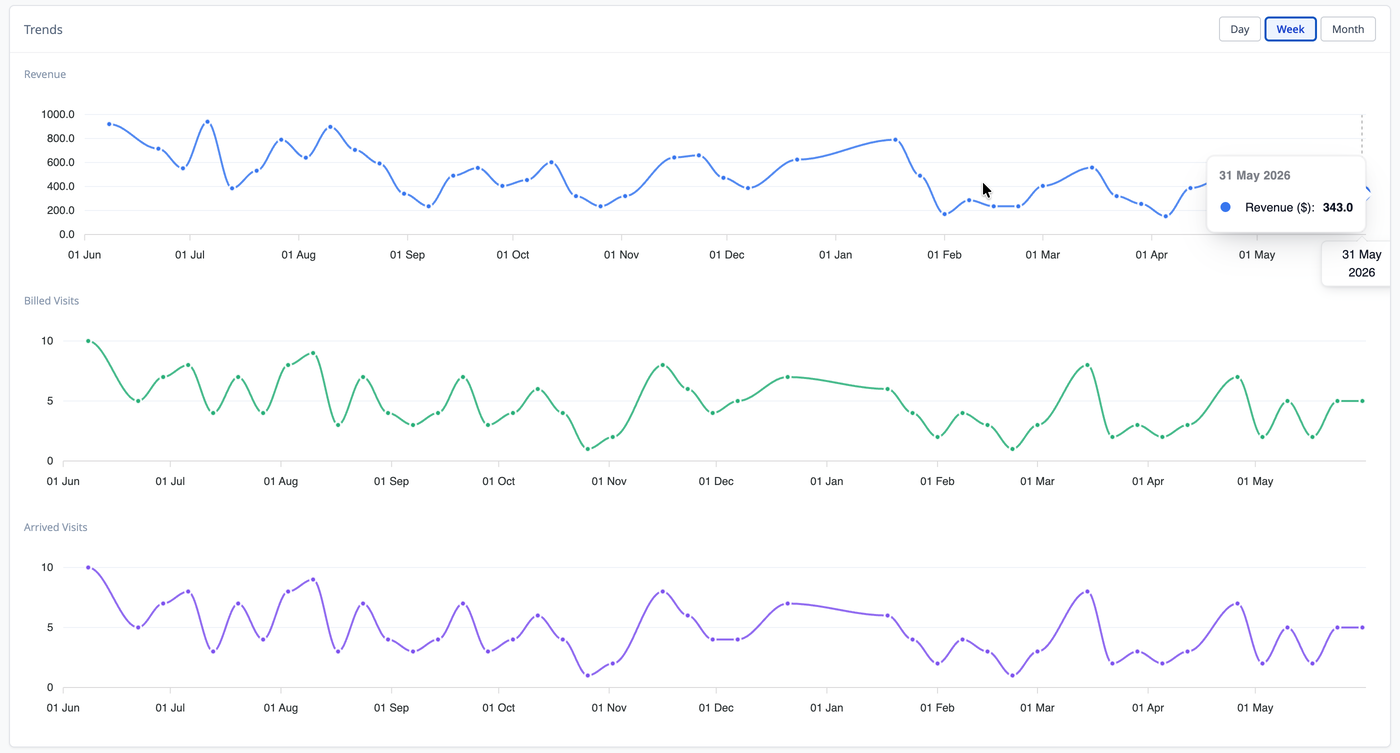
Use the Day, Week, and Month buttons in the top-right corner of the chart section to control how the data is grouped. Day plots each day individually. Week groups data by calendar week, with the point plotted on the Sunday of that week. Month groups data by calendar month, with the point plotted on the last day of that month.
When you change the time period, the grouping is set automatically based on the length of the period: less than 32 days uses Day, 32 to 182 days uses Week, and 183 days or more uses Month. You can override this at any time using the grouping buttons.
Hover over any data point to see the exact value and date. The chart always displays the full selected date range on the horizontal axis so gaps are visible. Scroll-to-zoom is disabled; use the period controls at the top of the page to change the date range.
Referral Statistics
The Referral Statistics table breaks down new patient activity by referral source for the selected period. It shows the referral source recorded on each patient's file, the number of new patients with that source who joined in the period, their lifetime total billed visits, their lifetime total revenue, and the derived PVA, AVV, and TPR figures. Patients with no referral source recorded are grouped under Not listed. The table is sorted by number of new patients, highest first.
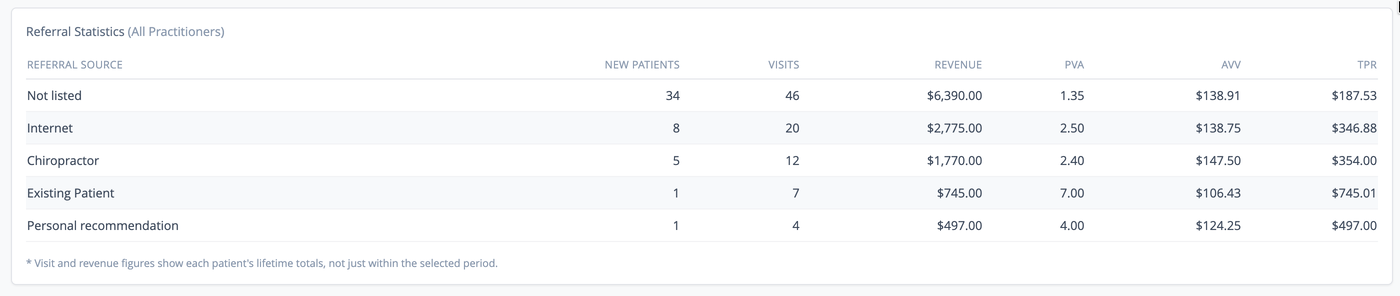
The Visits and Revenue columns show lifetime figures for the patients who joined in the selected period, not activity limited to that period. This is intentional, as it gives a more meaningful picture of the long-term value generated by each referral source. A note below the table is shown as a reminder of this.
The table only appears when at least one new patient joined the practice during the selected period. If none did, a message is shown in its place.
Common Questions
Why do Billed Visits and Arrived Visits show different numbers? Arrived Visits counts appointments marked as Arrived on the calendar. Billed Visits counts service items on invoices. Differences arise when appointments are not invoiced on the same day, when invoices are raised without a corresponding appointment, or when appointments are arrived but not yet billed.
Why are Credit Balances and Outstanding Accounts not filtered by date or practitioner? Account balances accumulate over time and represent a patient's current financial position with the practice. Filtering them by period or practitioner would give a misleading result, so they are always shown as practice-wide current figures. For practitioner specific balances, run the Account Balances report filtered by practitioner.
Why does the Referral Statistics section sometimes not appear? The table only displays when there is at least one new patient with a date joined falling within the selected period. If no new patients joined during that time, the section is hidden.